Research Article | | Peer-Reviewed

Synthesis of 4-Anisidine/Cyclodextrin Covered Copper Nanomaterials and pH-Dependent of 4-Anisidine–Cyclodextrin Inclusion Complexes

Received: 11 March 2026     Accepted: 23 March 2026     Published: 2 April 2026
Views:       Downloads:
Abstract

The spectral properties of the copper–4-anisidine–cyclodextrin (Cu: 4AS: CD) nanomaterial were examined using absorption, fluorescence, time-resolved fluorescence, SEM, DSC, FTIR, XRD, ¹H NMR, and molecular modeling techniques. The distinct spectral variations observed for 4AS upon adding α-CD and β-CD at different pH values indicate that the resulting inclusion complexes adopt different structural geometries. While 4AS exhibits a single emission maximum in all solvents and in α-CD solutions, dual emission bands are observed in β-CD. The confined geometry of the α-CD cavity likely restricts the free rotation of the amino or methoxy substituents of 4AS, suppressing the formation of the intramolecular charge-transfer (ICT) state and thereby enhancing the normal emission. The calculated HOMO–LUMO energy gap, total energy, free energy, enthalpy, entropy, dipole moment, and zero-point vibrational energy of the CD: 2AP complex differed significantly from those of the isolated 4AS, α-CD and β-CD molecules, and both the vertical and horizontal bond lengths between the amino and methoxy groups are smaller than the β-CD cavity size confirming the formation of an inclusion complex. SEM images and EDX analysis of the Cu: 4AS: β-CD nanomaterial reveal the presence of copper. In the FTIR spectra, several characteristic peaks disappear in the Cu: 4AS: CD nanoparticles, indicating strong interactions between 4AS and copper nanoparticles. The ¹H NMR spectra show both upfield and downfield shifts of 4AS proton signals support strong coordination of 4AS with copper in the CD-based nanomaterials.

Published in American Journal of Applied Chemistry (Volume 14, Issue 2)
DOI 10.11648/j.ajac.20261402.11
Page(s) 18-29
Creative Commons

This is an Open Access article, distributed under the terms of the Creative Commons Attribution 4.0 International License (http://creativecommons.org/licenses/by/4.0/), which permits unrestricted use, distribution and reproduction in any medium or format, provided the original work is properly cited.

Copyright

Copyright © The Author(s), 2026. Published by Science Publishing Group

Keywords

4-Anisidine, Cyclodextrin, Copper Nano, Inclusion Complex, Nanomaterials

1. Introduction
Cyclodextrins (CDs) readily form inclusion complexes with a wide range of guest molecules whose polarity and dimensions complement their unique architecture, characterized by a hydrophobic inner cavity and a hydrophilic exterior. Owing to this structural versatility, CDs have found extensive applications in the pharmaceutical industry They are also widely used as model systems for proteins and enzymes, as their interactions with various substrates often resemble those observed in biological systems. In pharmaceutical formulations, the inclusion of drug molecules within CD cavities can significantly modify drug properties. The increasing interest in CDs arises from their ability to enhance the solubility, chemical stability, and bioavailability of poorly soluble drugs, reduce toxicity, and regulate drug-release rates, among other benefits Hence, understanding the inclusion behavior of diverse molecular systems is of considerable importance.
In this context, we report: (i) the absorption and fluorescence spectral shifts, as well as the first excited singlet-state lifetimes of 4-anisidine (4AS) in α-CD, β-CD, and in solvents of varying polarity and pH; (ii) the proton-transfer behavior of 4AS in aqueous, α-CD, and β-CD media; (iii) the structural features and geometries of the inclusion complexes based on PM3 molecular modeling; and (iv) the influence of 4AS: CD doping on copper nanomaterials, examined using DSC, FTIR, ¹H NMR, and SEM techniques
2. Materials and Methods
2.1. Preparation of CD Solution
A 2 × 10⁻² M stock solution of 4-anisidine (4AS) was prepared. Aliquots of 0.1 or 0.2 mL of this stock solution were transferred into separate 10-mL volumetric flasks, followed by the addition of α-CD or β-CD solutions at varying concentrations (0.2, 0.4, 0.6, 0.8, and 1.0 × 10⁻² M). Each mixture was then diluted to 10 mL with triply distilled water and thoroughly shaken. The final concentration of 4AS in all samples was maintained at 4 × 10⁻⁴ M. All measurements were performed at room temperature (298 K).
2.2. Preparation of Cu: 4AS: CD Nanomaterials
A 1 × 10⁻³ M CuSO₄ solution (100 mL) in a round-bottom flask was reduced by the dropwise addition of 1% sodium borohydride while stirring vigorously on a magnetic stirrer–hot plate. As reduction progressed, the solution color changed from pale blue to reddish brown. Subsequently, 5 mL of 1% trisodium citrate was added dropwise as a stabilizing agent.
Separately, CD (1 mmol) was dissolved in 40 mL of distilled water, and 4AS (1 mmol) dissolved in 10 mL of ethanol was slowly added to the CD solution. The mixture was stirred at 50°C for 2 hours. The freshly prepared copper nanoparticle solution was then added and the combined mixture was stirred for an additional 2 hours. The resulting dilute solution was gently heated to 40–50°C until its volume was reduced by approximately 50%. The solution was then refrigerated overnight at 5°C. The precipitated Cu–4AS–CD nanomaterial was collected by filtration, washed with small amounts of ethanol and water to remove uncomplexed 4AS, copper, and CD, and then dried under vacuum at room temperature. The purified powder was stored in an airtight container and used for subsequent analyses
3. Results and Discussion
3.1. Absorption and Fluorescence Spectral Results
The absorption and fluorescence maxima of 4-anisidine (4AS) in pH ~3, pH ~7 and pH ~11 phosphate buffer solutions containing various concentrations of α-CD and β-CD are summarized in Table 1 and depicted in Figs. 1 and 2. These data were used to examine the inclusion behavior of the neutral and monocationic forms of 4AS across the three pH conditions. In CD-free solutions, 4AS exhibits the following spectral characteristics: pH ~3: λabs = 280, 222 nm; λflu = 368 nm, pH ~7: λabs = 295, 232 nm; λflu = 369 nm, pH ~11: λabs = 295, 231 nm; λflu = 368 nm. These results confirm that 4AS exists predominantly as the monocation at pH ~3 and in the neutral molecular form at pH ~7 and pH ~11. At pH ~7, the absorption (295, 232 nm) and emission (369 nm) maxima correspond closely to those observed in non-aqueous solvents, supporting assignment to the molecular (neutral) species.
Upon increasing α-CD and β-CD concentrations, the following trends were observed in the ground-state.
a) pH ~3: Absorbance increases in both CDs, accompanied by a blue shift (from 280, 222 nm to 272, 220 nm).
b) pH ~7: In α-CD, absorbance increases without significant spectral shifts (295, 231 nm).
In β-CD, absorbance decreases at 295 nm while a new band appears at 272 nm, indicating a hypsochromic shift resembling the spectrum in acidic (pH ~2) medium.
c) pH ~11: Both α-CD and β-CD show a slight increase in absorbance at unchanged wavelengths (295, 231 nm). The overall spectral pattern resembles that of CD-free pH ~7 solution.
With increasing α-CD and β-CD concentrations the following trends were observed in the excited state.
a) pH ~3: In α-CD, emission intensity increases with a small blue shift (369 → 363 nm). In β-CD, emission at 369 nm decreases, while a weak band grows around 440 nm.
b) pH ~7: In α-CD, emission intensity increases at 368 nm. In β-CD, emission at 368 nm decreases, whereas new emission enhancements appear at 325 nm and 440 nm.
c) pH ~11: Emission intensity increases in α-CD and decreases in β-CD at 368 nm. Overall fluorescence is much weaker at pH ~11.
At high β-CD concentrations, the absorption maxima at pH ~2 and pH ~7 become nearly identical. Similarly, at pH ~11, the absorption maxima in high β-CD levels match those of CD-free pH ~7 solution. The very weak fluorescence intensities at pH ~11 are attributed to the monoanion, which is considerably less fluorescent than the neutral species.
Table 1. Absorption and fluorescence maxima of 4-Anisidine (4AS) with different α-CD and β-CD concentrations.

Concentration of CD x10-3 M

pH - 3.0

pH - 7

pH - 11

abs

log

flu

τ

abs

log

flu

τ

abs

log

flu

τ

4AS only (in water)

280 222

3.17

369 323

0.47 0.23

295 231

3.35

368

0.59

295 231

3.30

368

0.24

0.2 M α-CD

273 220

3.28

364 324

0.51 0.20

296 233

3.37

367

0.62

295 232

3.33

368

0.26

1.0 M α-CD

272

220

3.32

363 324

0.64 0.14

296

232

3.43

367

0.72

295 232

3.38

369

0.29

0.2 M β-CD

273

220

3.00

368

0.53

295

275

221

3.18

365

0.62

295 231

3.32

368

0.27

1.0 M β-CD

272

220

3.33

367

0.71 0.18

272

220

2.70

363

0.81

0.22

294 232

3.34

368

0.32

K (1: 1) x105 M-1 in α-CD

98

127

81

220

173

326

G (kcal mol-1) in α-CD

-11.55

-17.0

-11.0

-13.5

-12.9

-14.5

K (1: 1) x105 M-1 in β-CD

227

877

256

253

216

382

G (kcal mol-1) in β-CD

-13.6

-17.0

-13.9

-13.9

-13.5

-14.9

Excitation wavelength (nm)

280

290

290

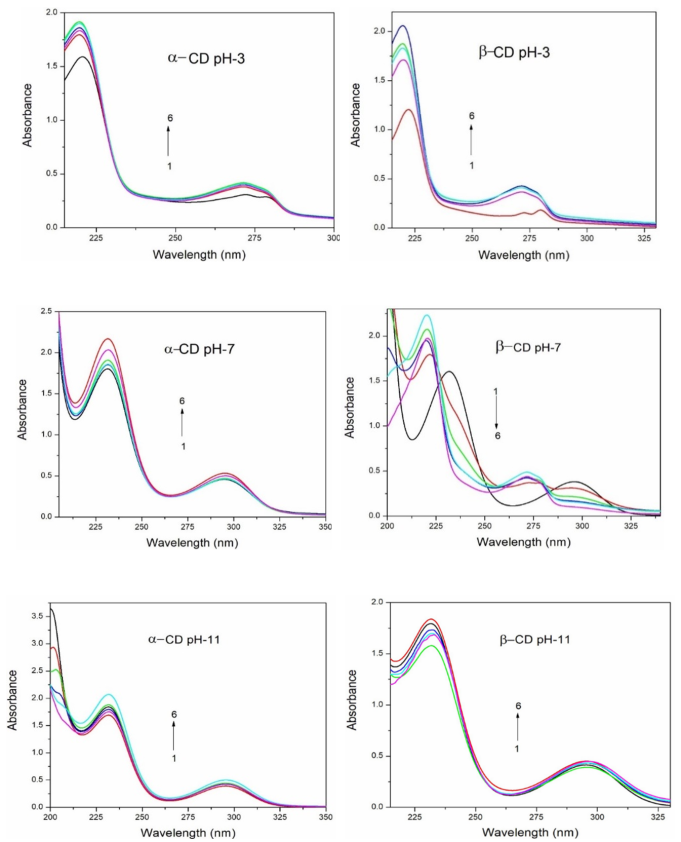
Figure 1. Absorbance spectra of 4AS in different α-CD and β-CD concentrations (M): (1) 0, (2) 0.002, (3) 0.004, (4) 0.006, (5) 0.008 and (6) 0.01.
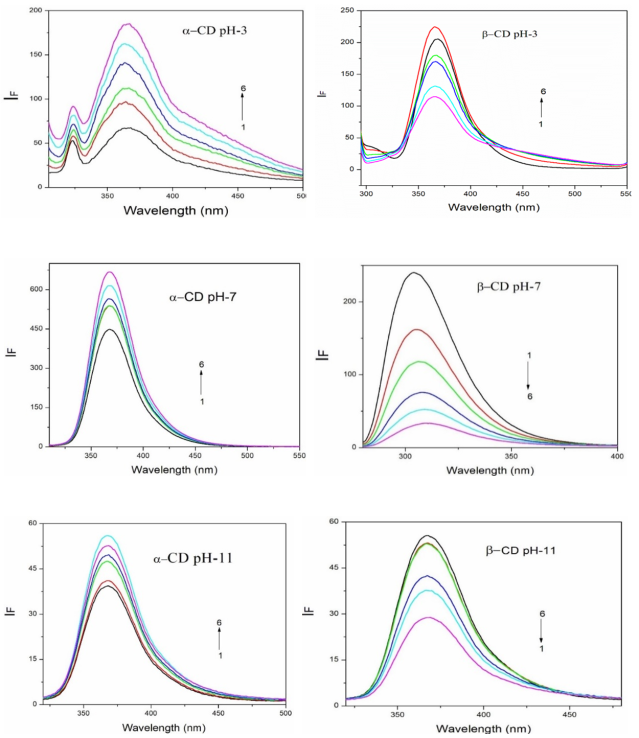
Figure 2. Fluorescence spectra of 4AS in different α-CD and concentration(M): (1)-0, (2) 0.002, (3) 0.004, (4) 0.006, (5) 0.008 and (6) 0.01.
Compared to other solvents (cyclohexane: λabs~305, 236 nm, λflu~337 nm; acetonitrile: λabs ~308, 240 nm, λflu~357 nm; methanol: λabs ~300, 236 nm, λflu ~362 nm) the absorption maxima of the 4AS in water (pH~7) is blue shifted (295, 232 nm) and emission spectrum is red shifted (365 nm) On comparison to aniline (cyclohexane: λabs ~283, 235 nm, λflu~320 nm; acetonitrile: λabs~286, 238 nm, λflu~329; methanol: λabs ~284, 232 nm, λflu ~ 334; water: λabs ~278, 230 nm, λflu ~335 nm) the absorption maxima of 4AS are red shifted in all the solvents. Further, when compared to phenol (cyclohexane: λabs ~277-271 nm, λflu~300 nm; acetonitrile: λabs~278-272 nm, λflu~302; methanol: λabs ~275-272 nm, λflu ~ 305; water: λabs~272-278 nm, λflu~305) the absorption maxima of 4AS exhibit red shifts in all solvents, indicating effective electronic delocalization between the amino and hydroxy groups. In acidic medium (pH ~3), the spectral pattern remains essentially unchanged except for a blue shift (280, 222 nm), whereas the basic medium (pH ~11) shows absorption maxima identical to those of the neutral species. The observed blue shift at pH ~3 reflects protonation at the amino group, leading to formation of the monocation. These observations are consistent with the known electronic characteristics of the amino and hydroxyl substituents
The observed variations in absorbance, emission intensities, and spectral maxima arise from the encapsulation of 4AS within the α-CD and β-CD cavities. In all three pH conditions, the presence of clear isosbestic points in the absorption spectra confirms the formation of a 1: 1 inclusion complex. Fluorescence enhancement is most pronounced at pH ~3 and pH ~7, whereas only weak emission is observed in CD-free pH ~11 solutions. Upon increasing α-CD concentration, the emission intensity increases markedly, while in β-CD it decreases. At pH ~7, the hypsochromic shift observed in β-CD suggests protonation at the amino group .
The distinct absorption and fluorescence spectral shifts produced by α-CD and β-CD across different pH values indicate the formation of structurally different inclusion complexes of 4AS . Binding constants were determined by monitoring the changes in absorption and fluorescence intensities as a function of CD concentration. The stoichiometry of the complexes was confirmed using the Benesi–Hildebrand method, and the binding constant (K) values were obtained from the slope and intercept of the linear plots. These analyses reveal that 4AS forms a 1: 1 complex with both CDs. The negative ΔG values (Table 1) demonstrate that the inclusion process is spontaneous at 303 K and that the interaction between 4AS and CD is exothermic.
The strong dependence of binding constants on pH supports selective encapsulation of the neutral and monocationic forms of 4AS. Higher binding constants and the observed blue shifts at pH ~7 and pH ~11 indicate that the neutral 4AS molecule is more completely embedded within the CD cavities. Moreover, 4AS appears to be more deeply lodged in the hydrophobic region of β-CD than in α-CD, owing to differences in cavity dimensions. The bond length and width between the –NH₂ and –OCH₃ substituents in 4AS (7.99 and 4.32 Å) exceed the α-CD cavity dimensions, whereas the remaining bond lengths are shorter. The progressive enhancement of fluorescence with α-CD and the corresponding quenching with β-CD support this structural interpretation. Thus, the distinct spectral changes induced by CD addition at different pH values suggest that the orientation and geometry of 4AS within the CD cavities vary with pH.
To further evaluate inclusion behavior, absorption and fluorescence spectra of 4AS were recorded in selected solvents. The absorption maxima shift to longer wavelengths from cyclohexane to acetonitrile but show blue shifts in alcohols and water, while the emission maxima consistently red shift from cyclohexane to water (cyclohexane: λabs~305, 236 nm, λflu~337 nm; acetonitrile: λabs ~308, 240 nm, λflu~350 nm; methanol: λabs~300, 236 nm, λflu~362 nm; water: λabs~295, 232 nm, λflu~365 nm). In all solvents, 4AS exhibits a single broad fluorescence band, and the absence of long-wavelength emission in polar solvents indicates that neither ICT nor exciplex formation occurs. Compared to phenol and aniline, the absorption maxima of 4AS are red shifted in all solvents (phenol in water: λabs ≈ 272–278 nm, λflu ≈ 330 nm; aniline in water: λabs ≈ 278 nm, λflu ≈ 335 nm), reflecting stronger electronic delocalization between the amino and methoxy groups.
3.2. Excited Singlet State Lifetimes
To evaluate CD-induced effects on the fluorescence behavior of 4AS, the emission decay profiles corresponding to the normal monomer emission (369 nm) and the excimer emission (440 nm) were recorded in water and in 0.01 M α-CD and β-CD solutions (Table 1). A marked increase in the excimer lifetime was observed on going from water to CD solutions. Although the relative intensity of the excimer band increased upon CD addition, such behavior was not seen in ordinary solvents. In aqueous and α-CD media, the decays were biexponential, whereas triexponential profiles were obtained in β-CD solutions. In contrast, monomer emission in water and other solvents decayed very rapidly and no excimer emission was detected. These observations clearly indicate excimer formation in the presence of CDs.
The lifetimes of the 4AS: CD inclusion complexes were longer than those of free 4AS, following the order: water < α-CD < β-CD. This trend suggests that β-CD forms a more stable and more strongly confining inclusion complex with 4AS than α-CD. The increase in lifetime with CD concentration reflects the progressive encapsulation of the dye within the CD cavity. The observed lifetimes are influenced both by the type of CD and by the nature of short-lived excited species, likely due to restricted vibrational relaxation of 4AS inside the cavities.
The enhanced lifetimes in CD solutions arise from confinement of 4AS within the host cavities. Deeper encapsulation in β-CD results in stronger host–guest interactions compared to α-CD. In CD-free water, the fluorescence decay fits a single-exponential function, but becomes multiexponential upon CD addition. This behavior is attributed to differences in the orientation and depth of penetration of 4AS within the two CD cavities. Longer lifetimes correspond to deeper encapsulation, whereas shorter lifetimes arise from loosely associated forms; hence, β-CD, with its larger cavity, yields greater fluorescence enhancement than α-CD. The monomer emission lifetime is extremely short in water but becomes altered upon CD addition. Introduction of CD leads to triexponential decay profiles for the excimer emission, accompanied by significant lifetime enhancement. The appearance of multiple excimer decay components further supports the formation of distinct inclusion complexes. Additionally, the rise time of the excimer emission—absent in water and different from the rapid monomer decay—lengthens with increasing CD concentration. This behavior demonstrates that excimer formation is substantially more favorable in CD solutions than in water.
3.3. Molecular Modeling
The formation of the inclusion complex was further validated through PM3 calculations. The ground-state geometries of 4AS, α-CD, β-CD, and their corresponding inclusion complexes were optimized using the PM3 method (Figure 3). The thermodynamic parameters for these species are listed in Table 2. For 4AS, the vertical and horizontal distances between the NH₂ and OCH₃ groups were found to be 7.99 Å and 4.32 Å, respectively (Figure 3). The vertical length of 4AS exceeds the cavity dimensions of α-CD and β-CD, whereas the horizontal length is smaller, suggesting that 4AS can be accommodated within the CD cavities. The optimized geometries of the complexes further confirm that the guest molecule is inserted into the CD cavity.
Upon encapsulation, the geometry of 4AS undergoes slight modifications, particularly in the dihedral angles, indicating that the guest adopts a specific conformation to achieve a stable complex. Significant changes in HOMO–LUMO energies, total energy, free energy, enthalpy, entropy, dipole moment, and zero-point vibrational energy of the CD: 4AS complexes compared to the isolated guest support the formation of the inclusion complex. The polarity of the cyclodextrin cavity also changes upon guest insertion. Negative values of energy, enthalpy, and Gibbs free energy demonstrate that the inclusion process is both energetically favorable and enthalpy-driven. The small negative ΔS value reflects a slight increase in system disorder associated with complex formation.
Table 2. Thermodynamic parameters and HOMO-LUMO energy calculations for 4AS and its inclusion complexes by PM3 method.

Properties

4AS

α-CD

β-CD

4AS: α-CD

4AS: β-CD

EHOMO (eV)

-8.03

-10.37

-10.35

-7.67

-7.72

ELUMO (eV)

0.21

1.26

1.23

0.34

0.42

EHOMO –ELUMO (eV)

-8.24

-11.63

-11.58

-8.01

-8.14

Dipole moment (D)

2.11

11.34

12.29

11.74

11.92

E*

-16.77

-1247.62

-1457.63

-1292.26

-1516.32

E*

-

-

-

-27.87

-41.92

G*

64.73

-676.37

-789.52

-617.61

-703.52

ΔG*

-

-

-

-5.36

-6.73

H*

92.07

-570.84

-667.55

-520.57

-596.92

ΔH

-

-

-

-41.8

-21.44

S**

0.091

0.353

0.409

0.463

0.469

ΔS**

-

-

-

0.019

-0.031

ZPE*

635.09

740.56

772.95

855.86

Mullikan charge

0.00

0.00

0.00

0.00

0.00

*kcal/mol; **kcal/mol-Kelvin; ZPE = Zero point vibration energy
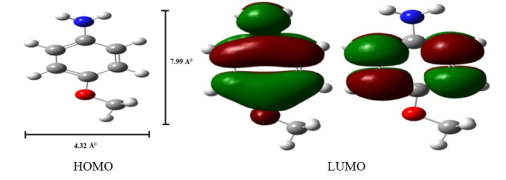
Figure 3. PM3 optimized structures of (a, b) 4AS (c, d) HOMO, LUMO of 2AS.
3.4. Cu: 4AS: CD Nanomaterials Studies
3.4.1. Scanning Electron Microscopy
The powdered samples of copper nanoparticles, 4AS, and the Cu: 4AS: α-CD and Cu: 4AS: β-CD nanomaterials were examined using SEM (Figure 4). The micrographs clearly reveal distinct morphological differences among copper nanoparticles, free 4AS, and the Cu: 4AS: CD nanomaterials. SEM–EDX analysis further confirmed the elemental composition of the complexes, showing 46.8% carbon, 49.0% oxygen, and 2.9% copper. The observed morphological modifications provide strong evidence for the successful formation of the Cu: 4AS: CD nanomaterials. The structural differences between pure Cu nanoparticles, free 4AS, and the Cu–4AS–CD inclusion complexes support the formation of the hybrid nanomaterials.
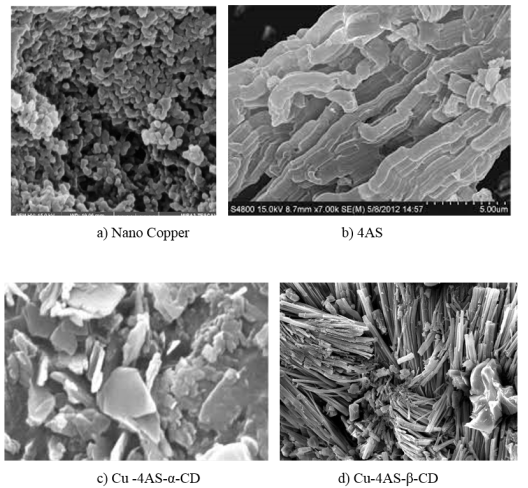
Figure 4. SEM images for a) Cu nano, b) 4AS, c) Cu: 4AS: α-CD and d) Cu: 4AS: β-CD.
3.4.2. Differential Scanning Colorimeter
DSC profiles of α-CD, β-CD, 4AS, and the Cu: 4AS: CD complexes were also recorded. α-CD exhibited three endothermic peaks at 79.2°C, 109.1°C, and 137.5°C, while β-CD showed a broad endothermic event at 128.6°C, all corresponding to the loss of crystalline water Pure 4AS displayed sharp thermal events at 57°C (melting point) and 243°C (boiling point). In contrast, the DSC thermograms of the Cu–4AS–CD complexes did not show the characteristic peaks of either free 4AS or the CDs. Instead, new peaks were observed at 195°C for Cu: 4AS: α-CD and 214°C for Cu: 4AS: β-CD. Additionally, a broadened endothermic region was noted for α-CD, β-CD, and their inclusion complexes, attributed to the release of bound water from the cyclodextrins.
3.4.3. Infrared Spectral Studies
For the isolated 4AS molecule (4AS), the N–H, –OCH₃, and C–H stretching vibrations appeared at 3447, 2837, and 3063 cm-1, respectively. The NH₂ deformation band and aromatic C=C stretching were observed at 1603 and 1521 cm-1. The aromatic C–C, C–OH, and C–O stretching modes appeared at 1472, 1173, and 1319 cm-1, while the C–O–C and C–N stretching bands were recorded at 1293 and 1306 cm-1. Ring deformation and CH₃ antisymmetric vibrations were found at 582 and 1440 cm-1. In the Cu: 4AS: CD nanomaterials, the NH₂ and –OCH₃ stretching bands shifted to 3287 cm-1, while the aromatic C=C and C–O stretches appeared at 1615 and 1343 cm-1. The aromatic ring deformation was observed at 564 cm-1, and the C–O–C and C–N stretching frequencies appeared at 1021 cm-1. The significant decrease in band intensity in the Cu: 4AS: CD complexes indicates strong interactions between 4AS and the copper nanoparticles.
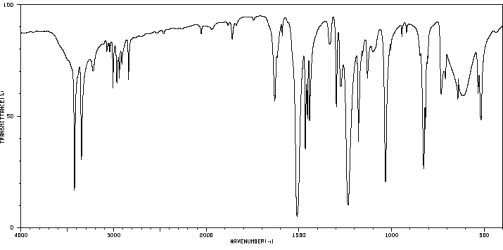
Figure 5. FTIR spectra of 4AS.
3.4.4. X RD Spectral Studies
The crystallinity of the nanoparticles was evaluated using XRD analysis . Pure copper nanoparticles exhibited prominent diffraction peaks at 43.31°, 50.44°, and 74.20°, which correspond to reflections of the face-centered cubic structure of metallic copper. The XRD patterns of α-CD showed characteristic crystalline peaks at approximately 11.94°, 14.11°, and 21.77°, while β-CD displayed peaks at 11.49° and 17.58°, although the intensity and appearance of these peaks may vary depending on sample conditions and preparation methods. Pure crystalline 4AS exhibited distinct diffraction peaks at 12.91°, 13.14°, 18.56°, 18.49°, 22.10°, 25.71°, 26.17°, 26.64°, 28.04°, and 28.45°. The XRD pattern of the Cu/4AS: β-CD nanomaterials displayed a new set of diffraction peaks at 14.91°, 15.14°, 26.56°, 33.10°, 46.71°, 47.64°, 59.04°, and 70.45°. The changes in peak positions and intensities compared with the pure components confirm the formation of new nanomaterials.
3.4.5. Proton Magnetic Resonance Spectral Studies
1H-NMR spectra of 4AS (Figure 6) and the Cu: 4AS: CD complexes were recorded at 25°C in DMSO-d₆ (Table 3). NMR provides insights into proton chemical shifts, interaction sites between the guest and host (CD), and signal broadening or loss of resolution resulting from complex formation. Cyclodextrins exhibit six types of protons with well-defined resonance assignments; among them, H-3 and H-5 are located inside the CD cavity. These inner protons typically show chemical shift changes when a guest molecule is included within the cavity, while only minor variations are expected for the exterior protons (H-1, H-2, and H-4).
In the Cu: 4AS: CD nanomaterials, the proton signals of 4AS displayed noticeable upfield shifts, indicating changes in their electronic environment. This shift, together with the perturbations observed for the CD cavity protons, demonstrates that the 4AS molecules interact strongly with both the copper nanoparticles and the cyclodextrin cavity. These NMR results confirm the successful formation of the inclusion-type nanomaterials.
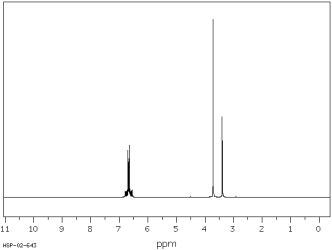
Figure 6. 1H-NMR spectra of 4AS.
Table 3. 1H-NMR chemical shift values for the 4AS and Cu: 4AS: CD nanomaterials.

Protons

4AS (δ)

Cu: 4AS: α-CD

Cu: 4AS: β-CD

Ha - Ortho to methoxy

6.71

5.68

5.73

Hb - Meta to methoxy

6.63

4.79

4.82

Hc - OCH3

3.72

4.46

4.49

Hd- NH2

3.40

2.48

2.51

1.23

1.24

4. Conclusion
The spectral characteristics of the Cu: 4AS: CD nanomaterials were examined using UV–visible spectroscopy, fluorescence and time-resolved fluorescence measurements, molecular modeling, SEM, DSC, FTIR, and ^1H NMR analyses. The absorption and fluorescence shifts observed in α-CD and β-CD at different pH values confirm that 4AS forms various types of inclusion complexes with the CDs. Fluorescence lifetime measurements further reveal that the β-CD: 4AS complex is more stable than the corresponding α-CD complex. SEM images clearly show distinct morphological differences among copper nanoparticles, free 4AS, and the Cu: 4AS: CD nanomaterials. SEM–EDX analysis confirmed the elemental composition of the nanomaterials, containing 46.8% carbon, 49.0% oxygen, and 2.9% copper. FTIR spectra of the Cu: 4AS: CD complexes showed the disappearance of several characteristic bands and a marked decrease in intensity, indicating strong interactions between 4AS and copper nanoparticles. Additionally, the chemical shift changes of 4AS in the ^1H NMR spectra demonstrate that all proton environments of 4AS are influenced by interactions with both the copper nanoparticles and the cyclodextrin cavity, supporting the successful formation of the Cu: 4AS: CD nanomaterials.
Abbreviations

FTIR

Fourier Transform Infrared Spectroscopy

DTA

Differential Thermal Analysis

XRD

X-ray Diffraction

SEM

Scanning Electron Microscopy

HOMO

Highest Occupied Molecular Orbital

LUMO

Lowest Unoccupied Molecular Orbital

4AS

4-anisidine

Ag NPs

Silver Nanoparticles

α-CD

Alpha Cyclodextrin

β-CD

Beta Cyclodextrin

PM3

Parametric Method 3

ΔE

Iinternal Energy Change

ΔH

Enthalpy Change

ΔG

Free Energy Change

ΔS

Entropy Change

Author Contributions
Narayanasamy Rajendiran: Methodology, Resources, Software, Supervision, Writing – original draft, Writing – review & editing
Ayyadurai Mani: Data curation, Formal Analysis, Investigation, Validation
Palanichamy Ramasamy: Data curation, Formal Analysis
Conflicts of Interest
The authors declare no conflict of interest.
References
[1] Tabushi, Cyclodextrin Catalysis as a Model for Enzyme Action. Acc. Chem. Res. 15(1982) 66-72.
[2] T. Tamalai, T. Kokubu, K. Ichimura, Electrochemical behaviour of N-cyclic imines and related cation radicals, Tetrahedron 43(1987) 1494-1500.
[3] R. Breslow, S. D. Dong, Biomimetic Reactions Catalyzed by Cyclodextrins and Their Derivatives. Chem. Rev. 98(1998) 199-218.
[4] B. Zsadun, M. Szilasi, F. Tudos, Chromatographic determination of vinyl chloride-monomer and its hydrolysis product in polystyrene tubing by gas-liquid chromatography, J. Chromatogr. 208(1981) 109-116.
[5] J. Chao, D. Mang, J. Li, H. Xu, S. Huang, Investigation of the molecular-level interaction between cyclodextrin and guest molecule by FT-Raman spectroscopy, Spectrochim. Acta A 60 (2004) 729-735.
[6] V. Ramamurthy, Photochemistry of organic molecules within confined crystal lattices, ACS Symp. Ser. 278(1985) 267-281.
[7] B. N. Rao, N. J. Tutro, V. Ramamurthy, Solid-state photochemical dimerisation of cis-chalcone in the presence of urea: a study of host-guest alignment and reaction course, J. Org. Chem. 51(1986) 460-465.
[8] M. M. Clasunski, P. Clements, B. L. May, C. J. Easton, S. F. Lincoln, Investigation of the host-guest interactions of β-cyclodextrin with mono- and di-functional phosphonic acids in aqueous solution, J. Chem. Soc. Perkin Trans. 2(2002) 947-953.
[9] J. B. Vincent, A. D. Sokolowski, T. V. Nguyen, G. Vigh, A family of single-isomer chiral resolving agents for capillary electrophoresis, Anal. Chem. 69(1997) 4226-4234.
[10] K. Vekema, F. Hirayama, T. Juie, Preparation and evaluation of high-performance biomaterials for bone repair: surface modification and in vitro characterization, High Perform. Biomater. (1999) 789-796.
[11] S. Akkın, G. Varan, D. Aksüt, M. Malanga, A. Ercan, M. Şen, et al., A different approach to immunochemotherapy for colon cancer: Development of nanoplexes of cyclodextrins and interleukin-2 loaded with 5-FU, Int. J. Pharm. 623(2022) 121940.
[12] N. A. Alhakamy, S. M. Badr-Eldin, O. A. A. Ahmed, H. M. Aldawsari, S. Z. Okbazghi, M. A. Alfaleh, et al., Green nanoemulsion stabilized by in situ self-assembled natural oil/native cyclodextrin complexes: An eco-friendly approach for enhancing anticancer activity of costunolide against lung cancer cells, Pharmaceutics 14(2022) 227.
[13] K. Zheng, X. Liu, H. Liu, D. Dong, L. Li, L. Jiang, et al., Novel pH-triggered doxorubicin-releasing nanoparticles self-assembled by functionalized β-cyclodextrin and amphiphilic phthalocyanine for anticancer therapy, ACS Appl. Mater. Interfaces 13(2021) 10674-10688.
[14] Y. Zhang, X. Li, X. Chen, Y. Zhang, Y. Deng, Y. Yu, et al., Construction of ultrasmall gold nanoparticles based contrast agent via host-guest interaction for tumor-targeted magnetic resonance imaging, Mater. Des. 217(2022) 110620.
[15] R. Zhang, X. You, M. Luo, X. Zhang, Y. Fang, H. Huang, et al., Poly(β-cyclodextrin)/platinum prodrug supramolecular nano system for enhanced cancer therapy: Synthesis and in vivo study, Carbohydr. Polym. 292(2022) 119695.
[16] Y. Yuan, T. Nie, Y. Fang, X. You, H. Huang, J. Wu, Stimuli-responsive cyclodextrin-based supramolecular assemblies as drug carriers, J. Mater. Chem. B 10(2022) 2077-2096.
[17] H. M. Ameen, S. Kunsági-Máté, L. Szente, B. Lemli, Encapsulation of sulfamethazine by native and randomly methylated β-cyclodextrins: The role of the dipole properties of guests. Spectrochim. Acta A 225(2020) 117475.
[18] M. Jamrógiewicz, K. Milewska, Sacharides and their derivatives as pharmaceutical additives Spectrochim. Acta A 219 (2019) 346.
[19] M. A. Chouker, H. Abdallah, A. Zeiz, M. H. El-Dakdouki, Host-guest inclusion complex of quinoxaline-1,4-dioxide derivative with 2-hydroxypropyl-β-cyclodextrin: Preparation, characterization, and antibacterial activity. J. Mol. Struct. (2021) 130273.
[20] M. Levine, B. R. Smith, Tuning fluorescence energy transfer for carcinogen detection and medical diagnostics. J. Fluoresc. 30 (2020) 1015.
[21] A. Mani, P. Ramasamy, A. Antony Muthu Prabhu, N. Rajendiran, Investigation of Ag and Ag/Co bimetallic nanoparticles with naproxen-cyclodextrin inclusion complex. J. Molecular Structure, 1284 (2023) 135301-10.
[22] A. Mani, G. Venkatesh, P. Senthilraja, N. Rajendiran, Synthesis and Characterisation of Ag-Co-Venlafaxine-Cyclodextrin Nanorods, European J Advanced Chemistry Research, 5(2024) 9-16.
[23] A. Mani, P. Ramasamy, A. Antony Muthu Prabhu, P. Senthilraja, N. Rajendiran, Synthesis and Analysis of Ag/Olanzapine /Cyclodextrin and Ag/Co/Olanzapine /Cyclodextrin Inclusion Complex Nanorods. Physics and Chemistry of Liquids, 62(2024) 196-209.
[24] A. Mani, P. Ramasamy, A. Antony Muthu Prabhu, P. Senthilraja, N. Rajendiran, Synthesis and Characterisation of Ag/Co/Chloroquine/Cyclodextrin Inclusion Complex Nanomaterials. J Sol-Gel Science and Technology 115(2025) 844-856.
[25] N. Rajendiran, A. Mani, M. Venkatesan, B. Sneha, E. Nivetha, P. Senthilraja, Spectral, Microscopic, Antibacterial and Anticancer Activity of Pyrimethamine drug with Ag nano, DNA, RNA, BSA, Dendrimer, and Cyclodextrins, J Solution Chem, In press.
[26] R. K. Sankaranarayanan, A. Antony Muthu Prabhu, N. Rajendiran, Inclusion complexation of 3,5-dihydroxy benzoic acid with β-CD at different pH. Indian J. Chemistry, 48A (2009) 1515-1521.
[27] R. K. Sankaranarayanan, A. Antony Muthu Prabhu, N. Rajendiran, A Study on the inclusion complexation of 3,4,5-trihydroxybenzoic acid with β-CD at different pH. J.Inclusion Phenomena and Macrocyclic Chemistry, 67(2010) 461-470,
[28] T. Stalin, P. Vasantharani, B. Shanthi, A.Sekar, N. Rajendiran, Inclusion complex of 1,2,3-trihydroxybenzene with α- and β-cyclodextrins. Indian J Chemistry, 45A (2006) 1113-1120.
[29] J. Prema Kumari, A. Antony Muthu Prabhu, G. Venkatesh, V. K. Subramanian, N. Rajendiran, Effect of solvents and pH on β-CD Inclusion complexation of 2,4-dihydroxy azobenzene and 4-hydroxy azobenzene. J. Solution Chemistry, 40(2011) 327-347.
[30] J. Prema Kumari, A. Antony Muthu Prabhu, G. Venkatesh, V. K. Subramanian, N. Rajendiran, Spectral characteristics of sulfadiazine, sulfisomidine: Effect of solvents, pH and β-CD. Physics and Chemistry of Liquids, 49(2011) 108-132.
[31] N. Rajendiran, R. K. Sankaranarayanan, Azo dye/Cyclodextrin: New findings of identical nanorods through 2: 2 inclusion complexes. Carbohydrate Polymers, 106(2014) 422-431.
[32] N. Rajendiran, R. K. Sankaranarayanan, J. Saravanan, A study of supramolecular host-guest interaction of dothiepin and doxepin drugs with cyclodextrin macrocycles. J Molecular Structure, 1067(2014) 252-260.
[33] A. Antony Muthu Prabhu, N.Rajendiran, Encapsulation of labetalol, and pseudoephedrine in β-CD cavity: Spectral and molecular modeling studies. J. Fluorescence, 22(2012) 1461-1474.
[34] M. Jude Jenita, G. Venkatesh, V. K. Subramanian, N. Rajendiran, Twisted Intramolecular Charge Transfer effects on fast violet B and fast blue RR: Effect of HP-α-CD and HP-β-CDs. J. Molecular Liquids, 178(2013) 160-167.
[35] N. Rajendiran, R. K. Sankaranarayanan, J. Saravanan, Nanochain and vesicles formed by inclusion complexation of 4, 4’-diamino benzanilide with Cyclodextrins. J. Experimental Nanoscience, 10(2015) 880-899.
[36] R. S. Sarpal, S. K. Dogra, Prototropism in aminophenols and anisidines: a reinvestigation, J.Photochem., 38(1987) 263-276.
[37] N. Rajendiran, M. Swaminathan, Luminescence characteristics of 4,4′-diaminodiphenyl methane in different solvents and at various pH, Spectrochim. Acta, 52A (1996) 1785-1792.
[38] T. Stalin, R. Anithadevi, N. Rajendiran, Spectral characteristics of ortho, meta and para dihydroxy benzenes in different solvents, pH and β-cyclodextrin, Spectrochimica Acta, 61A (2005) 2495-504.
[39] P Ramasamy, A Mani, B Sneha, E Nivetha, M Venkatesan, N Rajendiran, Azo-hydrazo tautomerism in Sudan Red-B and Cyclodextrin/ Sudan Red-B doped ZnO nanomaterials. J Molecular Structure 1329 (2025) 141423-32.
[40] P. Ramasamy, A. Mani, B. Sneha, E. Nivetha, A. Antony Muthu Prabhu, G. Venkatesh, N. Rajendiran,* Synthesis and Characterisation of Sudan Red-G/Cyclodextrin doped ZnO Nanocrystals. American J Physical Chemistry 14 (2025) 23-32,
[41] P. Ramasamy, A. Mani, B. Sneha, E. Nivetha, A. Antony Muthu Prabhu, G. Venkatesh, P. Senthilraja, N. Rajendiran*, Synthesis and Characterisation of Cyclodextrin /Methyl Violet doped ZnO Nanocrystals. Colloid and Surface Science 9 (2025) 19-30,
[42] P. Ramasamy, A. Mani, B. Sneha, E. Nivetha, A. Antony Muthu Prabhu, G. Venkatesh, P. Senthilraja, N. Rajendiran*, Synthesis and Characterisation of Cyclodextrin/ Sudan Black-B Caped ZnO/ Nanocrystals. American J Quantum Chemistry and Molecular Spectroscopy 9(2025) 1-11,
[43] P. Ramasamy, A. Mani, A. Antony Muthu Prabhu, G. Venkatesh, N. Rajendiran* Azo-Imino Tautomerism in Sudan Red 7B/Cyclodextrin Coated ZnO Nanocomposites: Evidence by Spectral and Microscopic Perspectives. Science Journal of Chemistry 13(2025) 65 - 75,
[44] P. Ramasamy, A. Mani, A. Antony Muthu Prabhu, G. Venkatesh, P. Senthilraja, N. Rajendiran* PICT Effects and Anticancer Potential on Rosaniline and Spectral Characterisation of Rosaniline/Cyclodextrin Covered ZnO/ Nanocrystals. International J. Pure and Applied Chemistry 26 (2025) 107-121,
[45] P. Ramasamy, A. Mani, P. Senthilraja, N. Rajendiran Keto-Enol Tautomerism and Anticancer Potential on Sudan Blue II and Synthesis and Characterisation of Sudan Blue II/ Cyclodextrin doped ZnO Nanocrystals, J. Materials Science and Nanotechnology, 13(2025) 1-16.
[46] P. Ramasamy, A. Mani, P. Senthilraja, N. Rajendiran, Spectral, Microscopic and Anticancer Activity Investigation on Dimethyl Yellow/Cyclodextrin Doped ZnO Nanocomposites Journal of Chemical and Pharmaceutical Sciences (JCHPS) 18(3) (2025) 33-43.
[47] P. Ramasamy, A. Mani, P. Senthilraja, N. Rajendiran, Spectral Characteristics of ZnO/Mordent Yellow 12/ Cyclodextrin Nanomaterials, J Chemical Health Risks, (JCHR) 15(2025) 542-553,
[48] P. Ramasamy, A. Mani, P. Senthilraja, S. Senthilmurugan, N. Rajendiran, Spectral, Microscopic and Anticancer Activity of 1, 8-Diaminonaphthalene Doped ZnO Nanocrystals, VVIJOURNAL 14 (2026) 135-147,
Cite This Article
  • APA Style

    Rajendiran, N., Mani, A., Ramasamy, P. (2026). Synthesis of 4-Anisidine/Cyclodextrin Covered Copper Nanomaterials and pH-Dependent of 4-Anisidine–Cyclodextrin Inclusion Complexes. American Journal of Applied Chemistry, 14(2), 18-29. https://doi.org/10.11648/j.ajac.20261402.11

    Copy | Download

    ACS Style

    Rajendiran, N.; Mani, A.; Ramasamy, P. Synthesis of 4-Anisidine/Cyclodextrin Covered Copper Nanomaterials and pH-Dependent of 4-Anisidine–Cyclodextrin Inclusion Complexes. Am. J. Appl. Chem. 2026, 14(2), 18-29. doi: 10.11648/j.ajac.20261402.11

    Copy | Download

    AMA Style

    Rajendiran N, Mani A, Ramasamy P. Synthesis of 4-Anisidine/Cyclodextrin Covered Copper Nanomaterials and pH-Dependent of 4-Anisidine–Cyclodextrin Inclusion Complexes. Am J Appl Chem. 2026;14(2):18-29. doi: 10.11648/j.ajac.20261402.11

    Copy | Download

  • @article{10.11648/j.ajac.20261402.11,
      author = {Narayanasamy Rajendiran and Ayyadurai Mani and Palanichamy Ramasamy},
      title = {Synthesis of 4-Anisidine/Cyclodextrin Covered Copper Nanomaterials and pH-Dependent of 4-Anisidine–Cyclodextrin Inclusion Complexes},
      journal = {American Journal of Applied Chemistry},
      volume = {14},
      number = {2},
      pages = {18-29},
      doi = {10.11648/j.ajac.20261402.11},
      url = {https://doi.org/10.11648/j.ajac.20261402.11},
      eprint = {https://article.sciencepublishinggroup.com/pdf/10.11648.j.ajac.20261402.11},
      abstract = {The spectral properties of the copper–4-anisidine–cyclodextrin (Cu: 4AS: CD) nanomaterial were examined using absorption, fluorescence, time-resolved fluorescence, SEM, DSC, FTIR, XRD, ¹H NMR, and molecular modeling techniques. The distinct spectral variations observed for 4AS upon adding α-CD and β-CD at different pH values indicate that the resulting inclusion complexes adopt different structural geometries. While 4AS exhibits a single emission maximum in all solvents and in α-CD solutions, dual emission bands are observed in β-CD. The confined geometry of the α-CD cavity likely restricts the free rotation of the amino or methoxy substituents of 4AS, suppressing the formation of the intramolecular charge-transfer (ICT) state and thereby enhancing the normal emission. The calculated HOMO–LUMO energy gap, total energy, free energy, enthalpy, entropy, dipole moment, and zero-point vibrational energy of the CD: 2AP complex differed significantly from those of the isolated 4AS, α-CD and β-CD molecules, and both the vertical and horizontal bond lengths between the amino and methoxy groups are smaller than the β-CD cavity size confirming the formation of an inclusion complex. SEM images and EDX analysis of the Cu: 4AS: β-CD nanomaterial reveal the presence of copper. In the FTIR spectra, several characteristic peaks disappear in the Cu: 4AS: CD nanoparticles, indicating strong interactions between 4AS and copper nanoparticles. The ¹H NMR spectra show both upfield and downfield shifts of 4AS proton signals support strong coordination of 4AS with copper in the CD-based nanomaterials.},
     year = {2026}
    }
    

    Copy | Download

  • TY  - JOUR
    T1  - Synthesis of 4-Anisidine/Cyclodextrin Covered Copper Nanomaterials and pH-Dependent of 4-Anisidine–Cyclodextrin Inclusion Complexes
    AU  - Narayanasamy Rajendiran
    AU  - Ayyadurai Mani
    AU  - Palanichamy Ramasamy
    Y1  - 2026/04/02
    PY  - 2026
    N1  - https://doi.org/10.11648/j.ajac.20261402.11
    DO  - 10.11648/j.ajac.20261402.11
    T2  - American Journal of Applied Chemistry
    JF  - American Journal of Applied Chemistry
    JO  - American Journal of Applied Chemistry
    SP  - 18
    EP  - 29
    PB  - Science Publishing Group
    SN  - 2330-8745
    UR  - https://doi.org/10.11648/j.ajac.20261402.11
    AB  - The spectral properties of the copper–4-anisidine–cyclodextrin (Cu: 4AS: CD) nanomaterial were examined using absorption, fluorescence, time-resolved fluorescence, SEM, DSC, FTIR, XRD, ¹H NMR, and molecular modeling techniques. The distinct spectral variations observed for 4AS upon adding α-CD and β-CD at different pH values indicate that the resulting inclusion complexes adopt different structural geometries. While 4AS exhibits a single emission maximum in all solvents and in α-CD solutions, dual emission bands are observed in β-CD. The confined geometry of the α-CD cavity likely restricts the free rotation of the amino or methoxy substituents of 4AS, suppressing the formation of the intramolecular charge-transfer (ICT) state and thereby enhancing the normal emission. The calculated HOMO–LUMO energy gap, total energy, free energy, enthalpy, entropy, dipole moment, and zero-point vibrational energy of the CD: 2AP complex differed significantly from those of the isolated 4AS, α-CD and β-CD molecules, and both the vertical and horizontal bond lengths between the amino and methoxy groups are smaller than the β-CD cavity size confirming the formation of an inclusion complex. SEM images and EDX analysis of the Cu: 4AS: β-CD nanomaterial reveal the presence of copper. In the FTIR spectra, several characteristic peaks disappear in the Cu: 4AS: CD nanoparticles, indicating strong interactions between 4AS and copper nanoparticles. The ¹H NMR spectra show both upfield and downfield shifts of 4AS proton signals support strong coordination of 4AS with copper in the CD-based nanomaterials.
    VL  - 14
    IS  - 2
    ER  - 

    Copy | Download

Author Information